The web developer community’s love for Google Chrome is no secret. For most Javascript, node html or CSS tutorials and articles out there, the person teaching is using Chrome. And from personal experience, any time I get a new computer the very first thing I do is download Google Chrome. But I just recently came across an intriguing blog praising the developer tools available from Firefox.
It’s funny that I never considered exploring the developer tools on other browsers. Of course I’ve spent countless hours considering other libraries, text editors and extensions, just never the developer tools. This blog will outline available developer tools from the major internet browsers. Let’s take a look at what each has to offer, and highlight a few often overlooked hidden features.
Firefox Developer Tools
Firefox has a solid layout. Right click and inspect element (or Ctrl+Shift+I) to pull up the inspector tab. At the top users will find a menu with standard tools that most developers should be familiar with.

Screenshots can be a useful feature when working on a team, as sharing information in a team setting is vital. Firefox offers a simple tool to take a screenshot of your browser, cutting out the middleman of opening another application to take that screenshot.
To access the screenshot feature, click the 3 dots in the upper right hand corner, and select settings.

Here you select a screenshot , and users have the ability to change the screenshot behaviors.

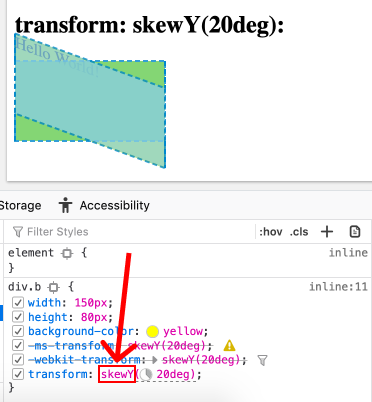
Developer tools from Firefox also try to simplify CSS, with the help of visual guides and the CSS property transform. Hover over the property to see its original position, and the current position.
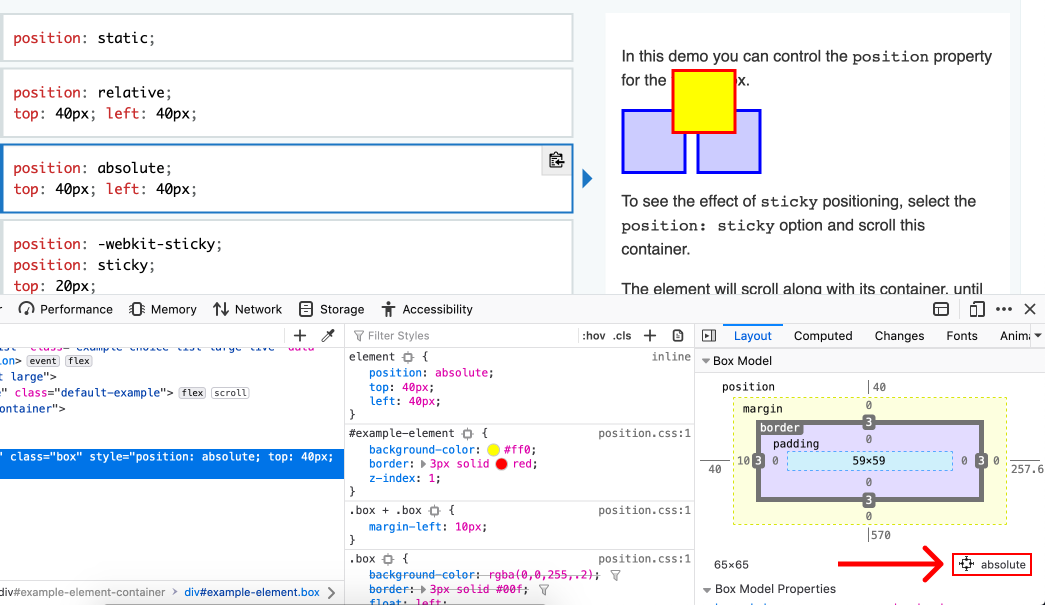
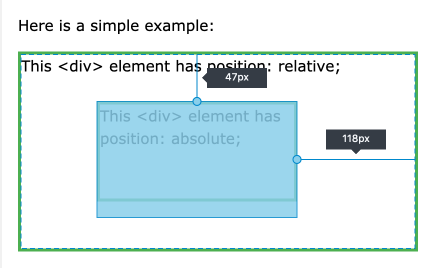
Another helpful feature – moving images with a position absolute. By clicking the absolute icon, grab handles appear, allowing users to move the image freely. Updated values will appear within the inline element box.
Safari Developer Tools
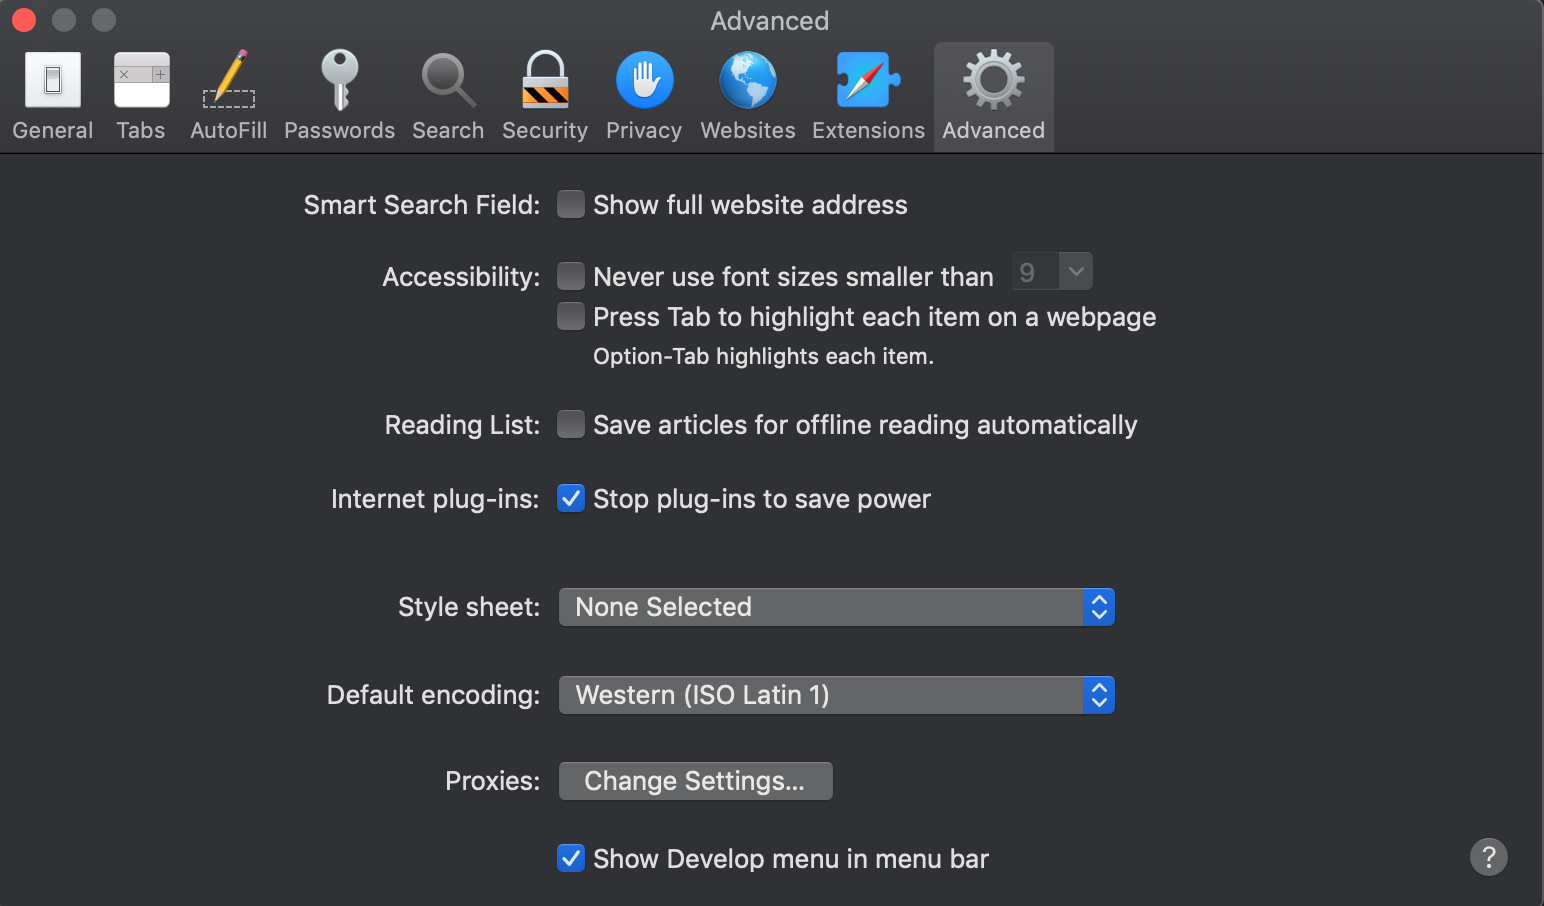
Safari developer tools require some setup if you’ve never used them before. To access the inspector, go to the navigation menu, select Safari, then choose preferences. In the following window, select advanced, then check Show Develop menu in menu bar. Now when you right click, Inspect Element should appear.
I imagine Safari is built more for the everyday user, rather than for developers. With the ability to inspect elements, there’s not much more to mention about Safari’s developer abilities. Safari also lacks official support documentation, which Chrome and Firefox provide.

Chrome Developer Tools
Chrome’s developer tools are easily accessed with a right click, and choosing inspect element.

Similar to Firefox, Chrome makes it easy to test the responsiveness of a webpage. With the ability to input dimensions or select the dimensions of specific android/iOS devices.
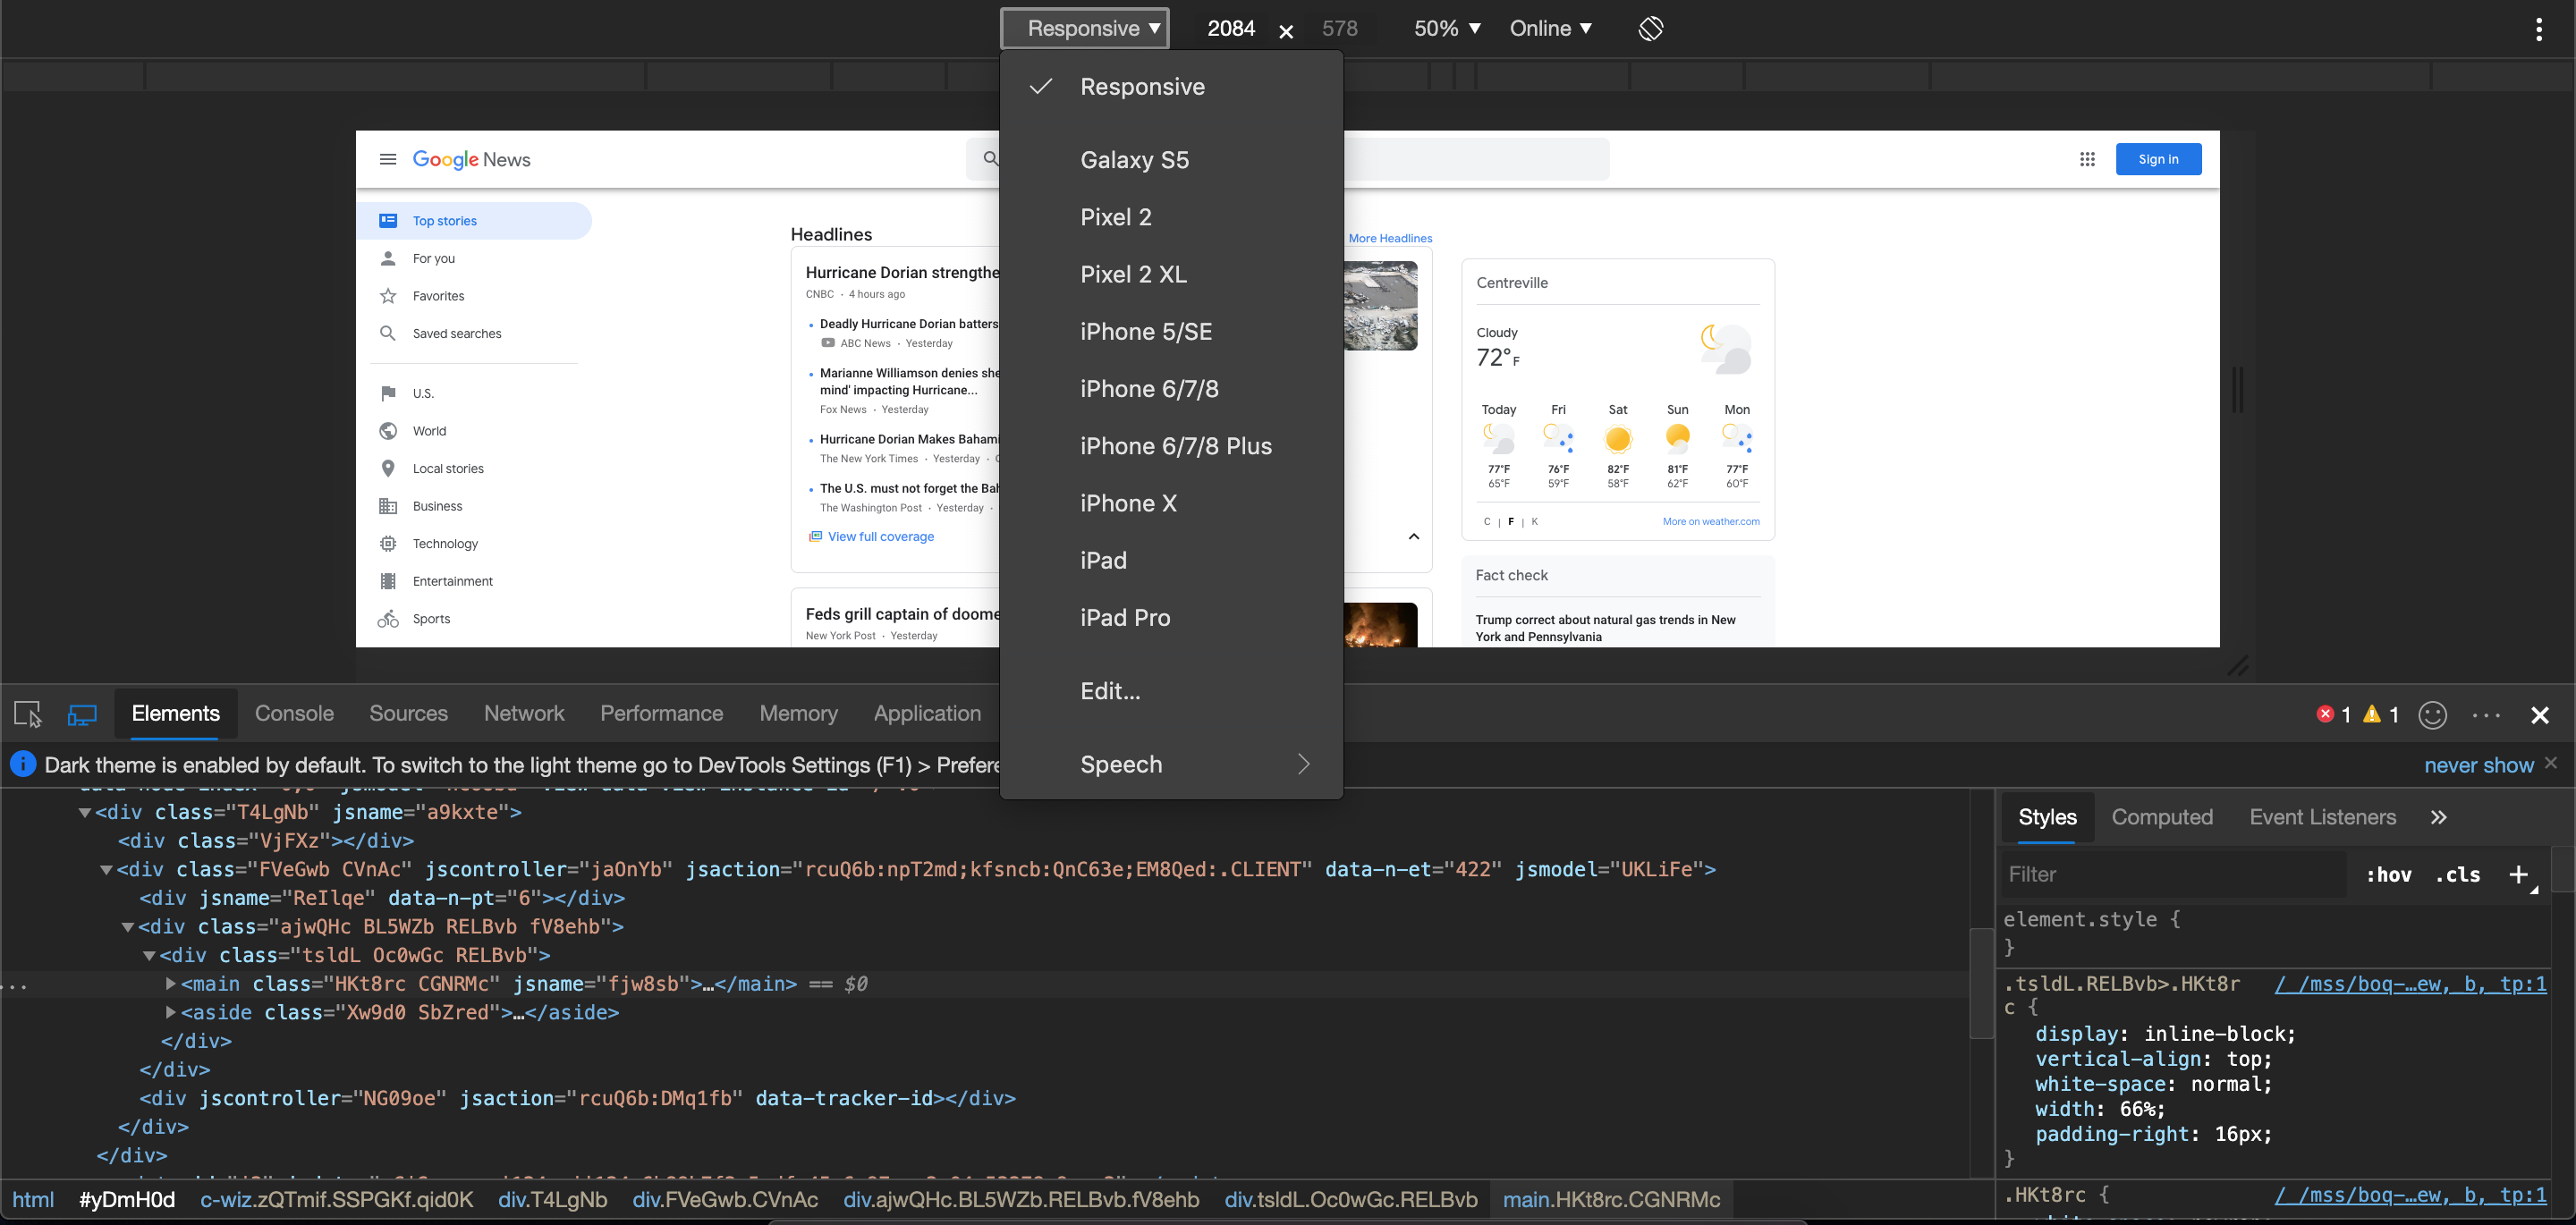
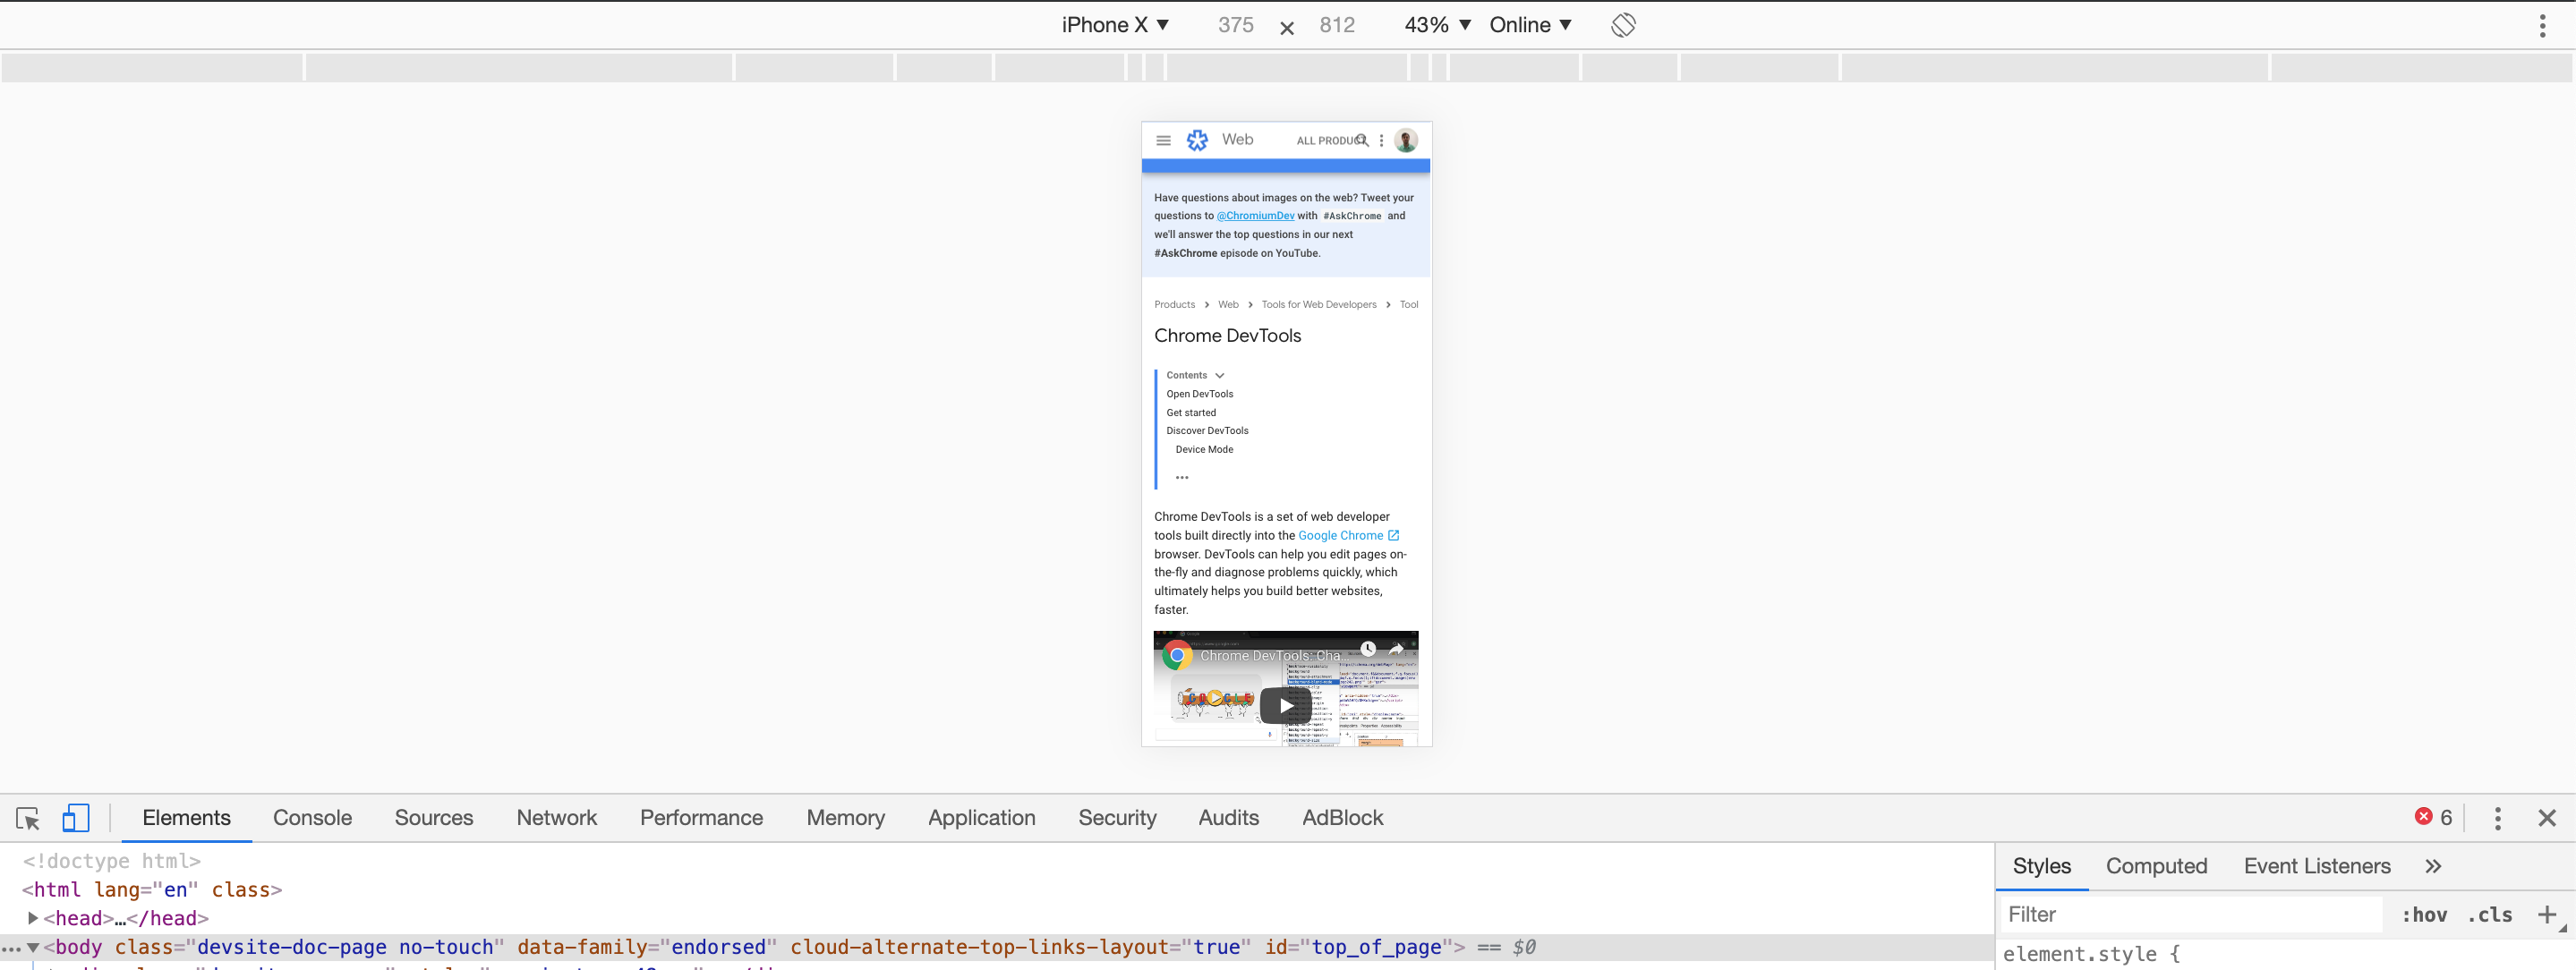
The same window offers users the ability to control screen orientation and mobile device reception.

Chrome offers official developers documentation, plus a comprehensive Youtube channel displaying new features and updates.
Edge (Microsoft edge insider Beta Channel)
The latest development with Microsoft Edge was their adoption of Chromium, the same rendering engine used by Google Chrome. Read more about that here. When inspecting elements we get a similar feel to chrome.
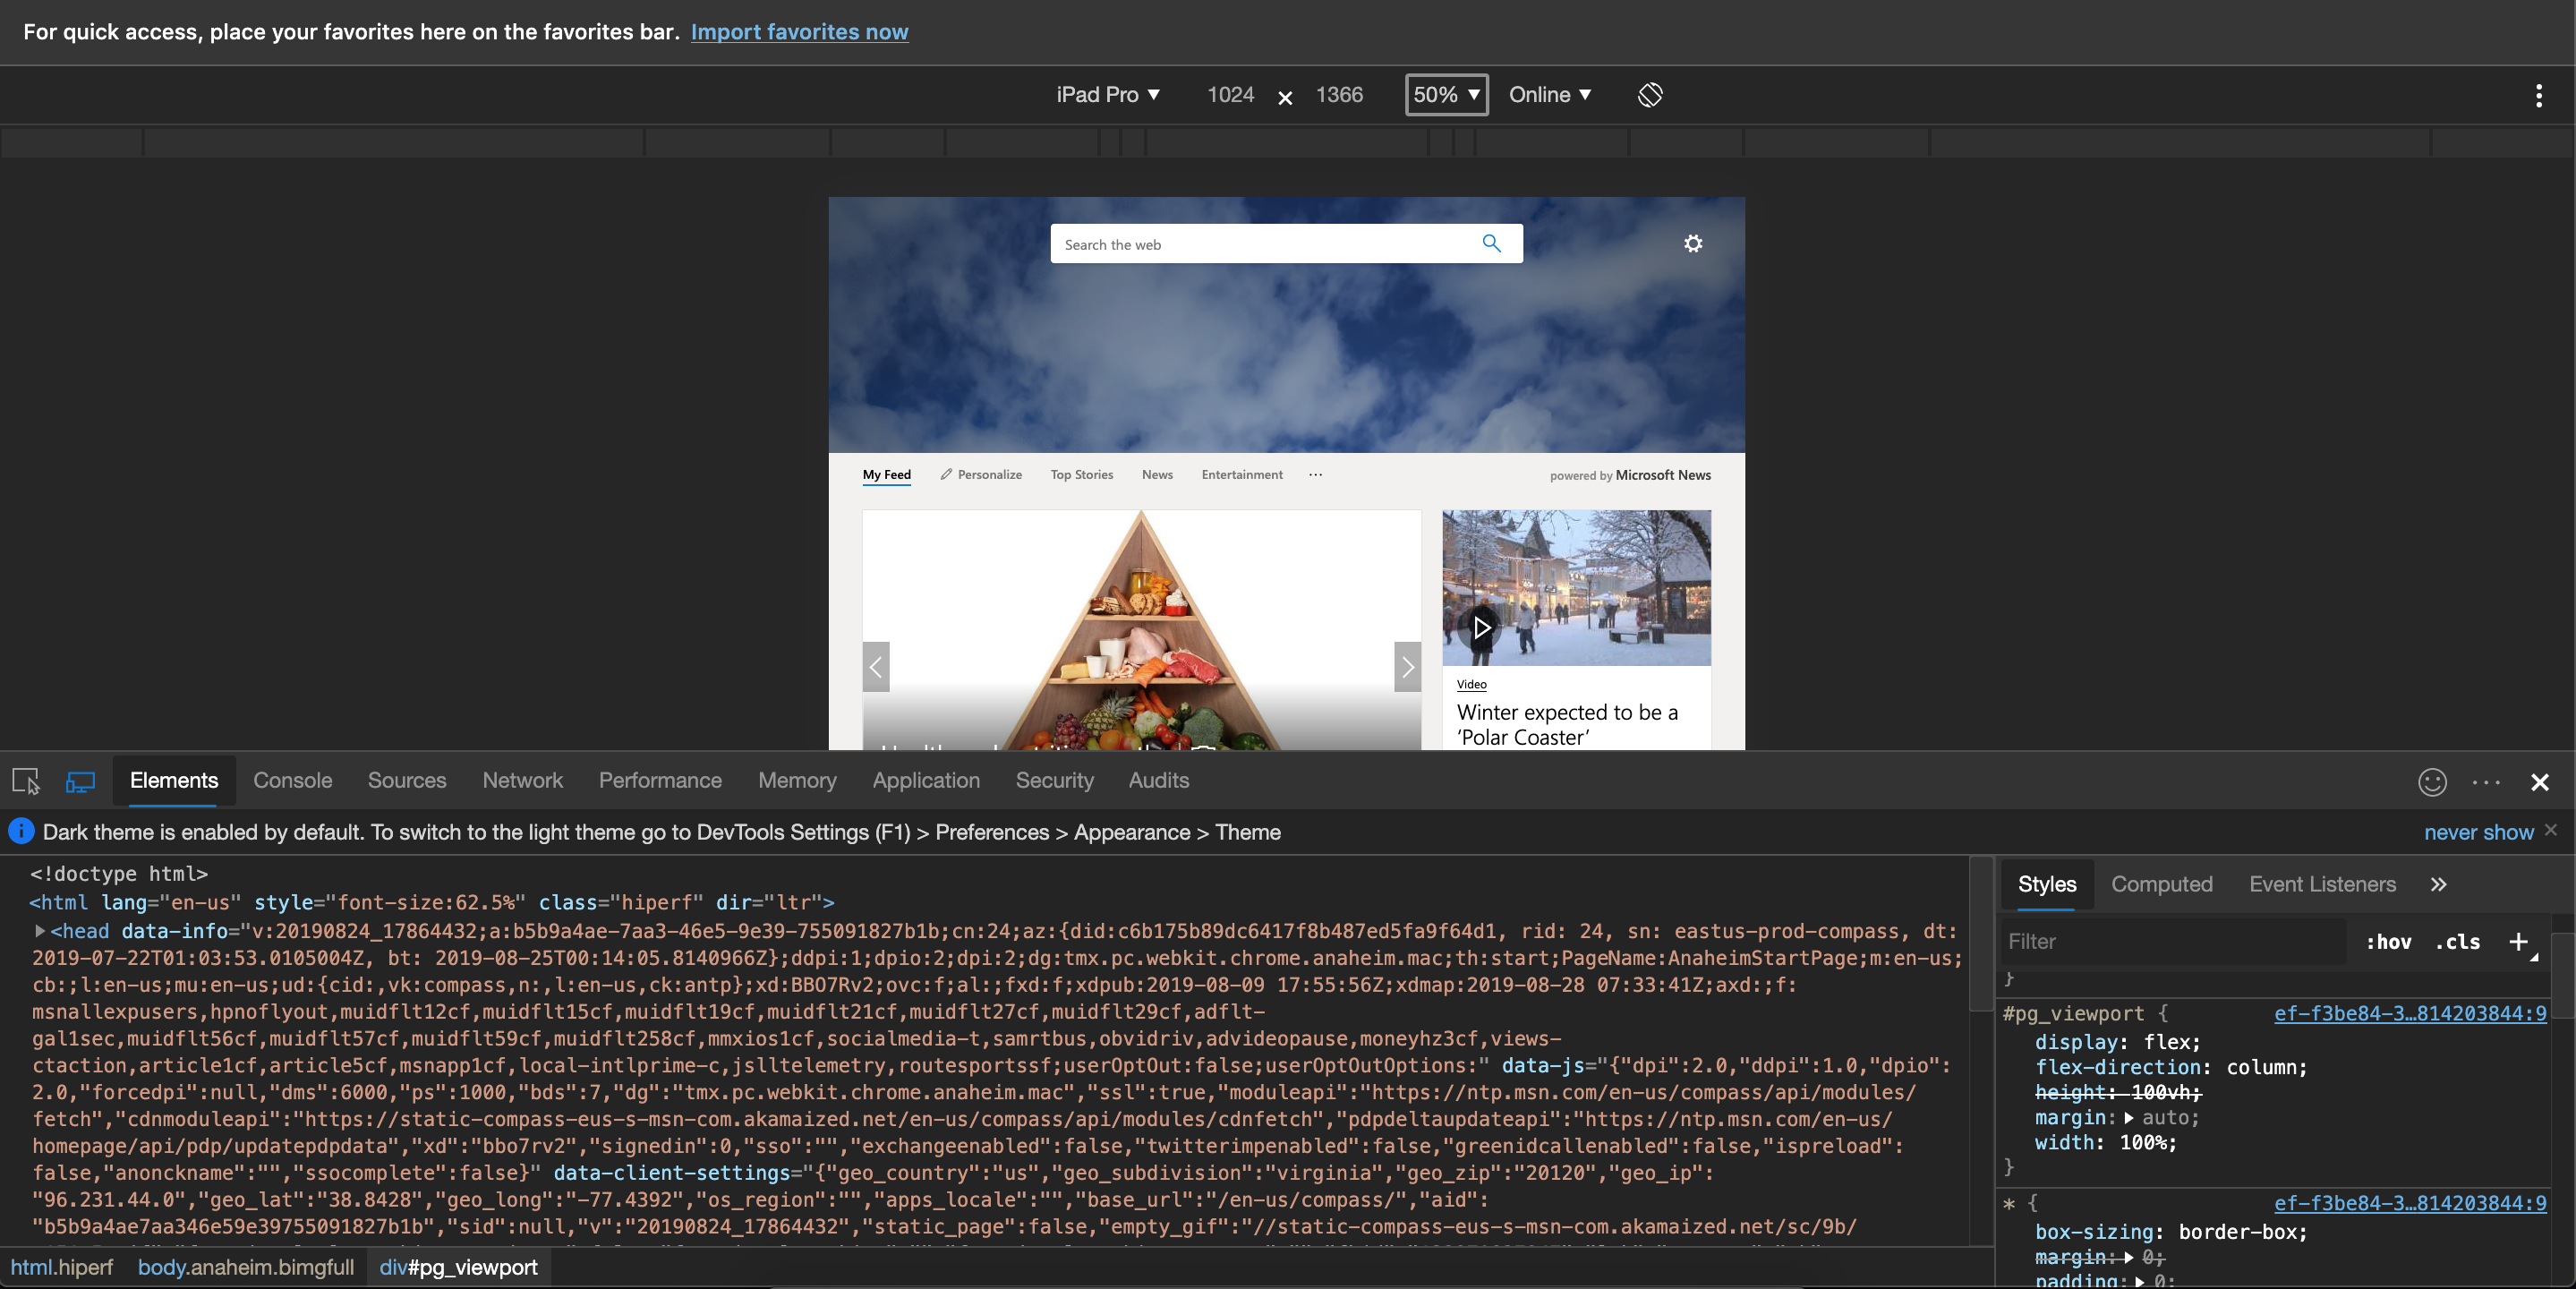
Edge also offers the same tools for responsive testing.

Overall I was genuinely surprised with the developer tools available from Firefox and Microsoft Edge. I found new features in Firefox that I’d never seen before. And Microsoft Edge has stepped up their game by adopting Google Chrome technology.
Get Support
No matter which developer tools you prefer, our team of GIS development experts can help you make your next project a reality. Explore our portfolio to see our past successes. And reach out to start a conversation about your next unique GIS project.


