ArcGIS Urban is a 3D web-based solution that manages urban development and planning workflows by streamlining the creation and sharing of land use and zoning plans, along with the ability to review proposed development projects. This process helps all organizations involved coordinate their efforts more effectively. This solutions tool allows users to view projects by size, type, and development status. The tool also provides the ability to visualize citywide plans and projects all in one place, allowing for collaboration amongst stakeholders and other interested parties.
To run ArcGIS Urban on your machine, there are a few requirements that are needed beforehand. The first of which involves having a browser that supports WebGL and WebAssembly. It’s also recommended that you are up to date on the latest version of Google Chrome or Mozilla Firefox. For all system requirements check out the official documentation.
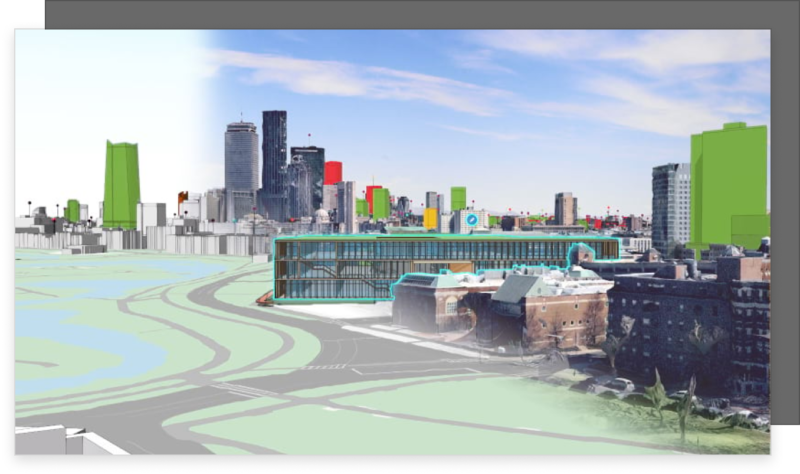
Within ArcGIS Urban users have the ability to view this 3D web map from either a satellite or schematic view. Upon viewing the map, users will notice city buildings scapes, modeled accurately to size. This is accomplished through the use of LiDAR data. Along with LiDAR data, other elements can be incorporated to visualize the surrounding landscape, such as tree survey data. This type of data doesn’t have to be perfect, just good enough to have a general idea of what the area/it will look like.

Image from Esri

Image from Esri
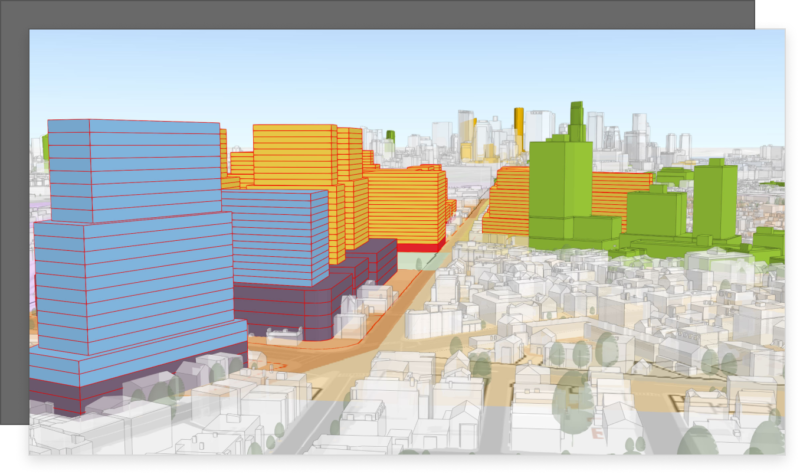
Another benefit of ArcGIS Urban involves the ability to view specific plans and processes for future or current development projects. The two types of plans that ArcGIS Urban supports are land use & zoning. These types of plans usually focus on larger, long-term (5-50yrs) development and zoning goals. For cities that like to predict future population growth, this type of data is critical for planners and developers when looking to meet and set goals. Providing users with the ability to edit new and existing zoning areas, determine the best type of building structure to use, the ability to overlay new or existing districts, and much more! Explore step-by-step instructions on how to edit a plan.
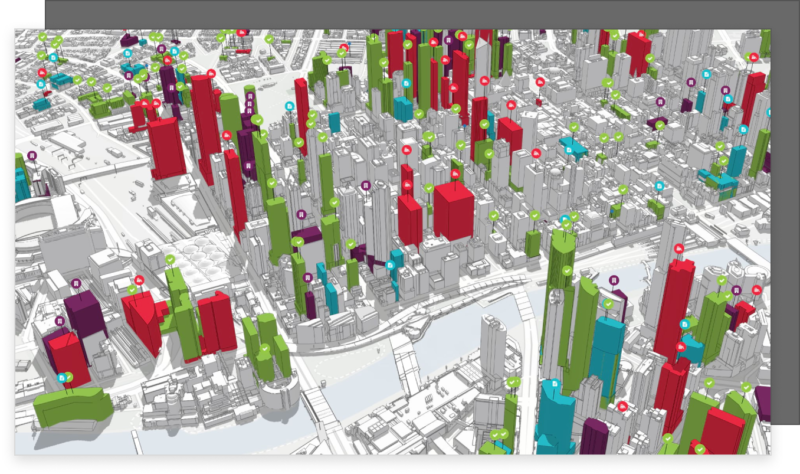
While viewing ArcGIS Urban’s 3D web-map, you will notice that all the buildings are set to greyscale. One of the cool features that ArcGIS Urban does for users is color coordinates specific buildings based on their project status and description. In ArcGIS Urban, a project plan refers to short-term assignments (1-5yrs). This method of status identification is constantly cycled and updated to keep all organizations involved up-to-date. The ability to view project models and statues ahead of time allows developers to edit designs/plans in real-time to determine if that project makes sense in the surrounding area. To perform these actions, discover these step-by-step instructions on how to edit a project and configure a project.

Image from Esri

Image from Esri
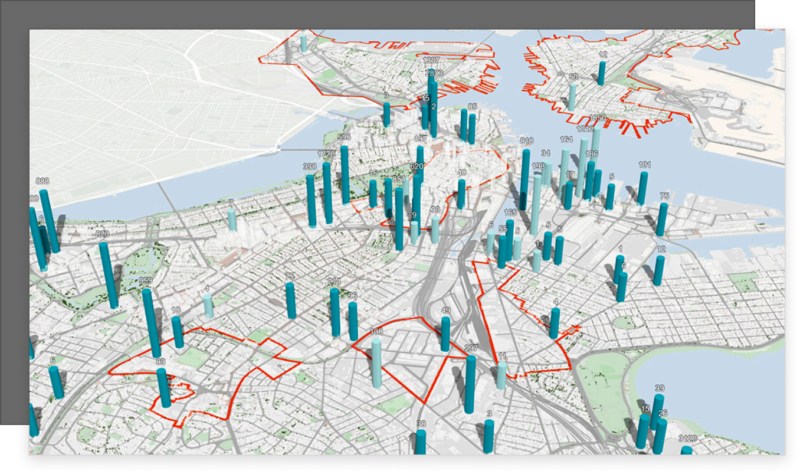
Along with color-coded buildings, ArcGIS Urban also displays color-coded pins or indicators that provide users with different insights that help better understand their work as well as additional aspects of the city. These indicators come in two forms. They either come from the ArcGIS Living Atlas – Indicators of the Planet (only available for cities in the United States), or they are custom-made by the user. For full details and step-by-step instructions on how to create custom indicators, see the Work with indicators page.
Hoping to leverage the power of ArcGIS Urban to manage your local development projects and proposals? Reach out to our GIS industry experts to start a conversation about your unique needs today. Seeking other professional GIS services? Explore our vast portfolio to learn about our past project successes.
Discover our past blogs on ArcGIS Urban: Building Smart Communities with ArcGIS Urban & Streamline Urban Development with ArcGIS Urban