ArcGIS Experience Builder offers up a new way to build web apps. The next generation of Web AppBuilder for ArcGIS, ArcGIS Experience Builder leverages a mobile-adaptive design to build powerful, user-friendly web apps with an easy drag-and-drop interface.
Before we dive into our tutorial, let’s take a quick look at Esri’s primary ArcGIS Experience Builder example, the Explore San Diego web app, which integrates both 2D and 3D maps, and leverages dynamic content interactions to help users explore the great city of San Diego.
ArcGIS Experience Builder Tutorial
Let’s dive into our tutorial highlighting the step-by-step process of creating your very own experience. Our tutorial will walk through the steps to create an experience focused on some 2020 mega music festivals in the United States.
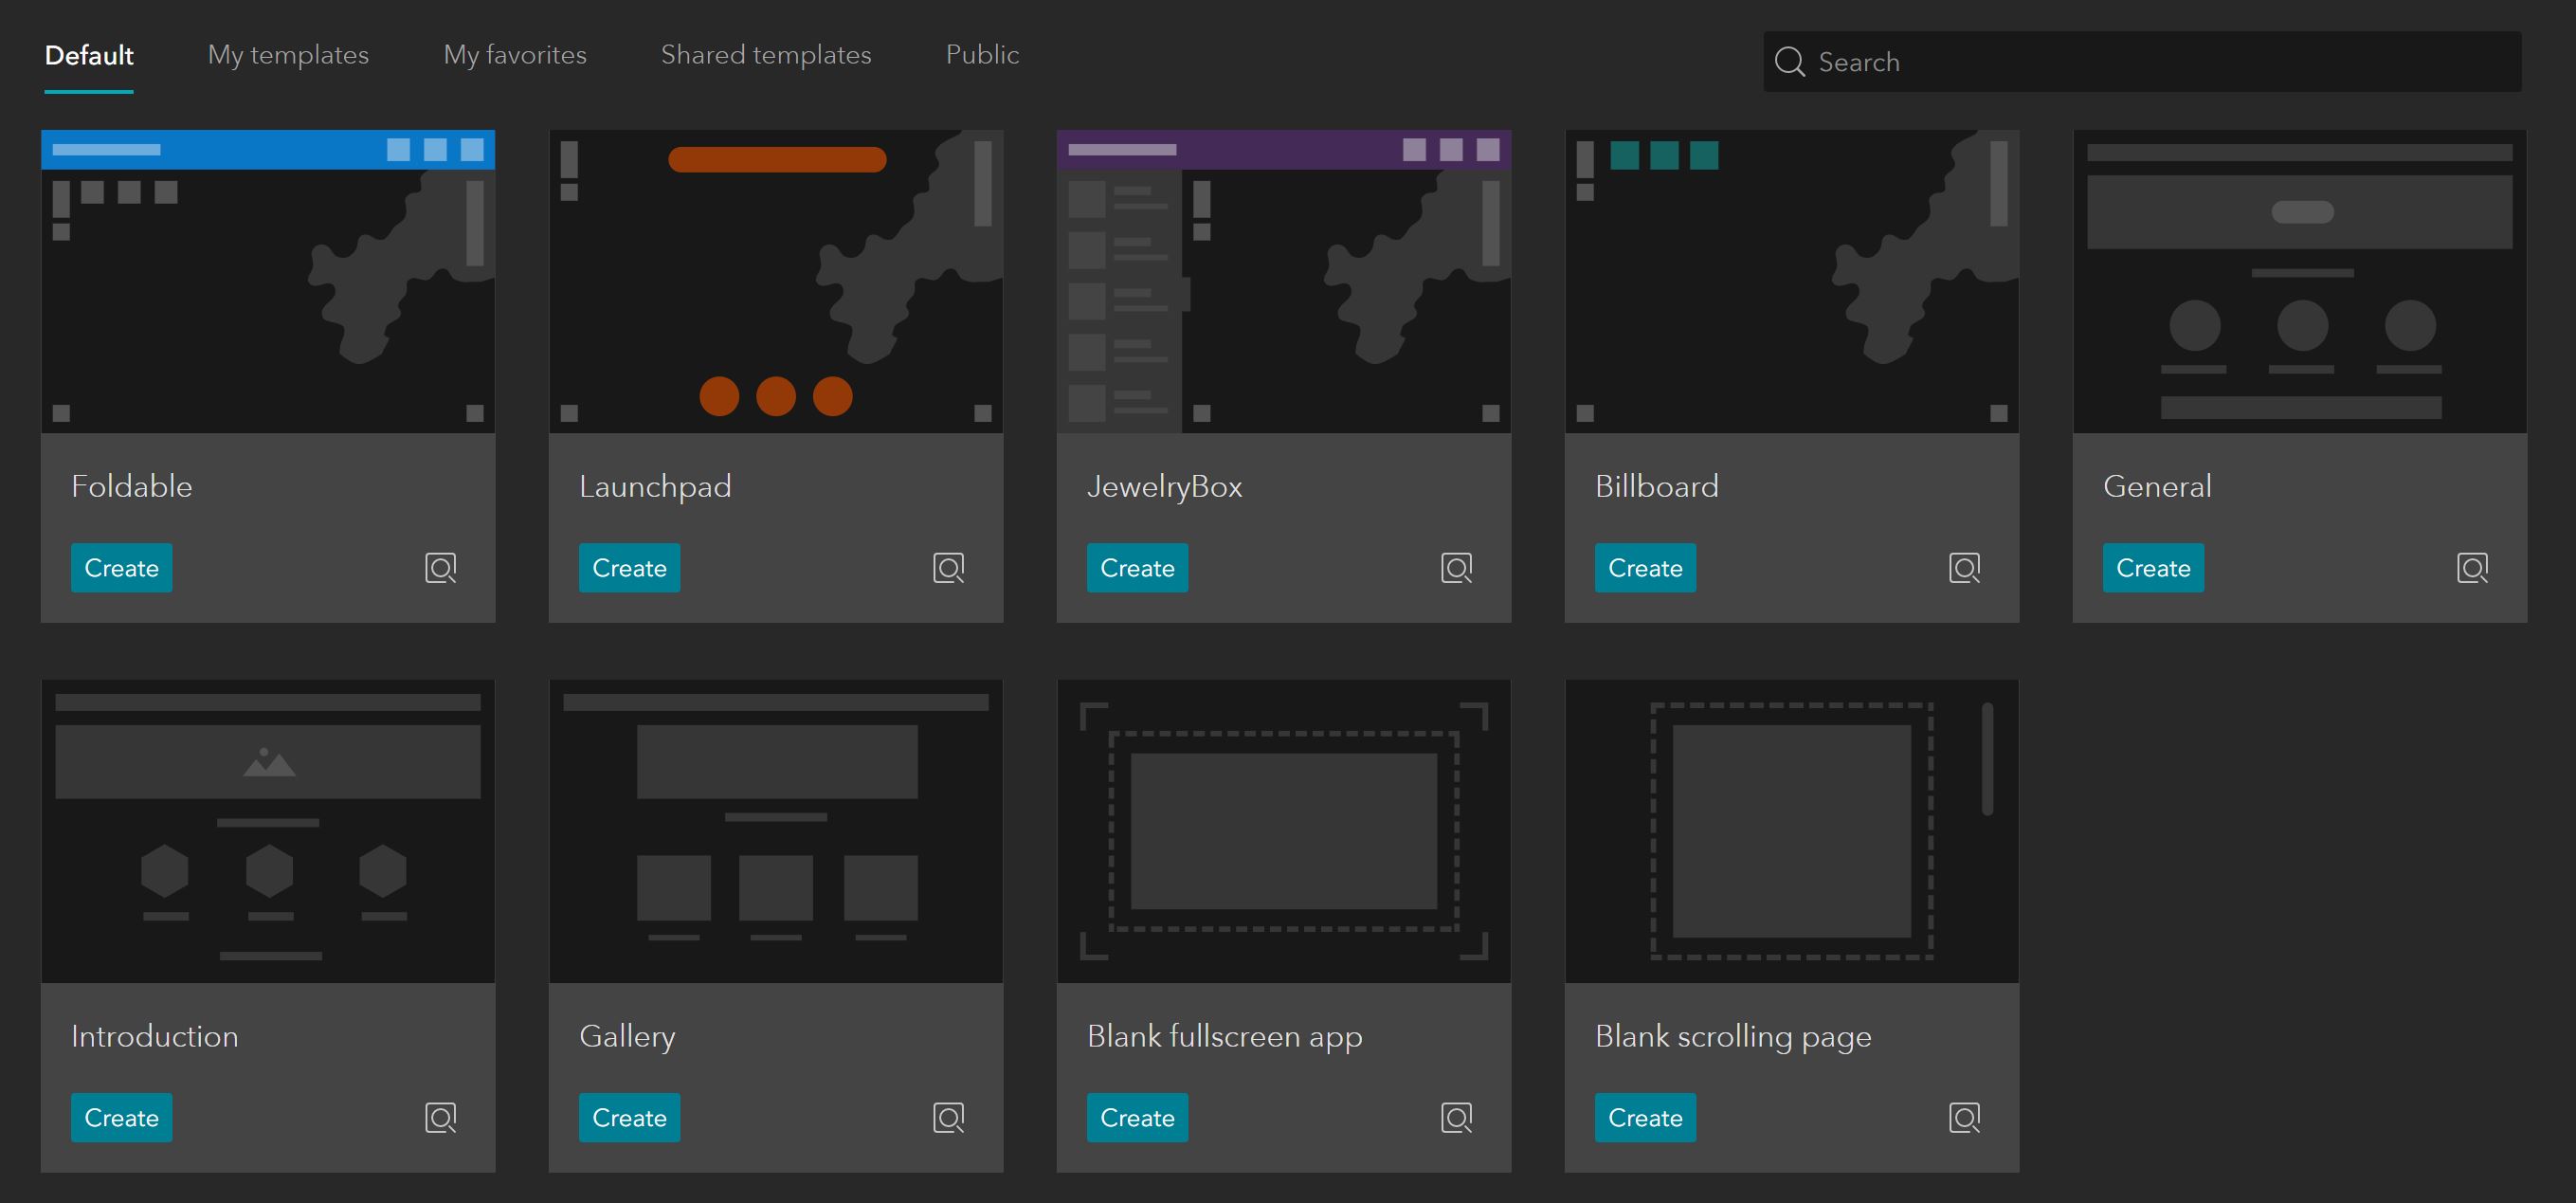
Getting started with ArcGIS Experience Builder is quick and easy. Either start with a pre-built template, or create your own experience entirely from scratch.
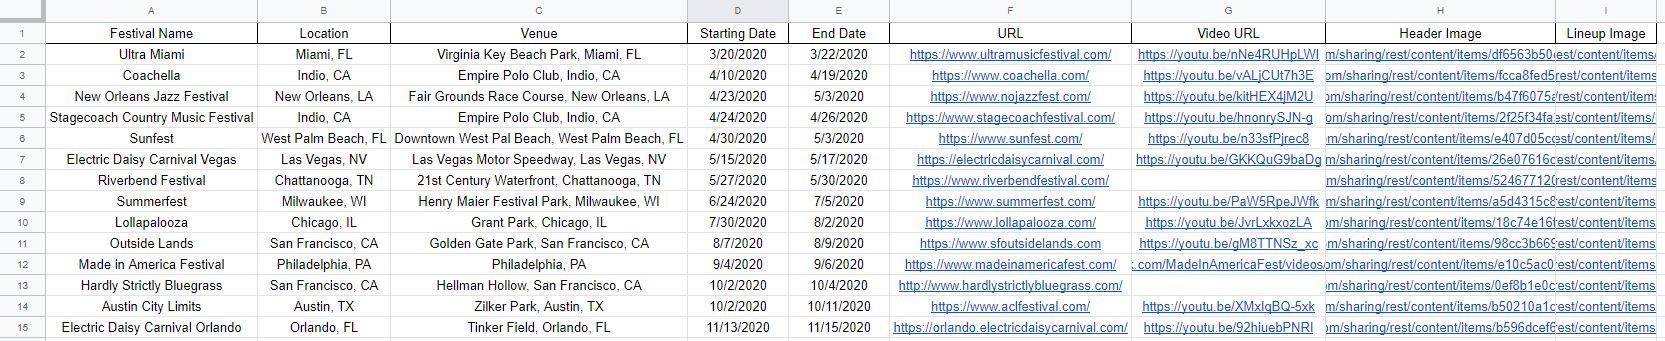
As with anything GIS, it all starts with the data. From this simple data table, we can create a dynamic and unique experience that highlights a variety of content and details relating to each music festival throughout the United States.
After building out and saving a simple web map in ArcGIS Online with our CSV dataset, it’s time to build our first experience. Navigating over to ArcGIS Experience Builder, click “+ Create new” to create a new experience. Then select your starting template, in this instance we’ll be creating our own blank fullscreen app.
Next we’ll give our experience an appropriate title and attach our data source, which is our previously created web map based on the CSV data table.
Building an experience is easy with the simple drag-and-drop interface. Let’s start by dragging in a “Column” widget, and then snapping the widget to fill the left section of the frame. As additional widgets can be organized within a Column widget, let’s drag in a “List” widget. After dropping a List widget in the frame, we’re presented with a few list template options that offer varying degrees of presented information from our data source.
- Drag Column widget into the frame and snap to the left side
- Drag a List widget into the Column widget
- Select List widget template, then click “Start”
- Click “Select data” to connect List widget to data source
- Click the image placeholder icon within the List widget, then select the “Dynamic” button option
- Click the revealed bracket icon, then select “{ } Attribute”
- Choose appropriate attribute to display dynamically from the data table (“Header image” in this example)
- Next, click the text area placeholder in the List widget, and select the far right pop-up option “Dynamic content”
- Select the appropriate field from the table, here we’ll choose “Festival name”
- Click the “button” placeholder
- Then find “Set link” on the right side of the screen
- From the dropdown, select “Web address”
- Click the button under “URL” and select “{ } Attribute”
- Choose the “URL” field from the data table, then click “OK”
- Update the “Text” with an appropriate title like “Visit Website”
With our List widget all set up, let’s add a map of the music festivals to the frame. In this section we’ll learn about the “Live view” button, and when to use it to interact with and test certain elements of the experience. After adding the map view of the data, we’ll set up a trigger that connects the List and Map widgets.
- Click the “+” icon in the top left corner to add a new widget
- Click the “Map” widget and drag it to an empty space in the frame, resizing to best fit the space
- Click “Select map” to attach your web map data source
- Select the “Live view” option at the top of the screen to interact with the map
- With “Live view” turned on, we can now pan, zoom, and select points on the map to reveal their pop-up information
- Turn off “Live view”
- Next, let’s connect the List and Map widgets with a trigger
- Click the List widget, then select the “Action” ribbon on the right
- Click “Add a trigger”
- Choose “Record Selection Changes” for the “Map 1” widget
- Select the “Zoom to” option
To test our recent additions, let’s click “Live view” again to interact with the List and Map widgets. Choosing a list item now results in a trigger that zooms in to the corresponding map point in the map on the right.
Now let’s add another widget to our experience. The “Embed” widget allows the embedding of external content, such as video URLs.
- Click the “+” icon in the upper left-hand corner
- Drag and drop the “Embed” widget into the frame
- With the “Embed” widget selected, click the “Content” ribbon in the right pane
- Click “Connect to data”, then select your data source to connect your data
- Click the button to the left of “URL from an attribute”, and select “{ } Attribute” from the dropdown
- Link to the “Video URL” field
Testing our updates in Live view, we can see how the content dynamically populates based on the list item selected. As each festival name in the list is selected, the embed widget dynamically populates the corresponding video URL.
Widgets within the experience can be rearranged at any time by selecting the widget and dragging it to a new area. Now let’s add another widget to display a bit more information about each festival.
- Again, click the “+” icon to insert a new widget
- Drag the “Image” widget into the empty space in the experience frame
- With the “Image” widget still selected, click “Connect to data” in the right panel, then click “Select data”
- Choose the appropriate dataset, then click the “Dynamic” bullet option on the right to reveal the attribute button
- Click the “{}” button, click “Attribute”, then select “Lineup image” from the field list
Testing in Live view, we can see how the newly added image widget is now dynamically populated as different festivals are selected.
To wrap things up, let’s add a header and title to our experience before viewing a preview of the final version.
- Click the “Page 1” option to deselect the active widget, then toggle on “Header” in the right panel
- With the top header now visible, click “Edit header”, then drag and drop a “Text” widget into the header area
- We’ll give the experience an appropriate title “2020 Mega Festivals in the US”, and increase the text size
- Click the text widget, and choose the far left dropdown to make the text area match the full width and height of the header container
- Click the save icon, then select the preview icon to view your fully built experience
As we select various points on the map, and items in the list widget, we can see how every element of the experience changes dynamically with our selection.
This tutorial has walked through the simple steps to create a dynamic experience with ArcGIS Experience Builder. This powerful ArcGIS web app has a lot to offer, which we’ll dive into further in future blog tutorials.
Get Support
Ready to start leveraging the power of ArcGIS Experience Builder? It all starts with access to the powerful ArcGIS platform. GeoMarvel can jumpstart your ArcGIS access with our ArcGIS Enterprise Jumpstart and ArcGIS Web Launch Kit professional service offerings. Reach out to our industry experts to start a conversation about your unique needs today.